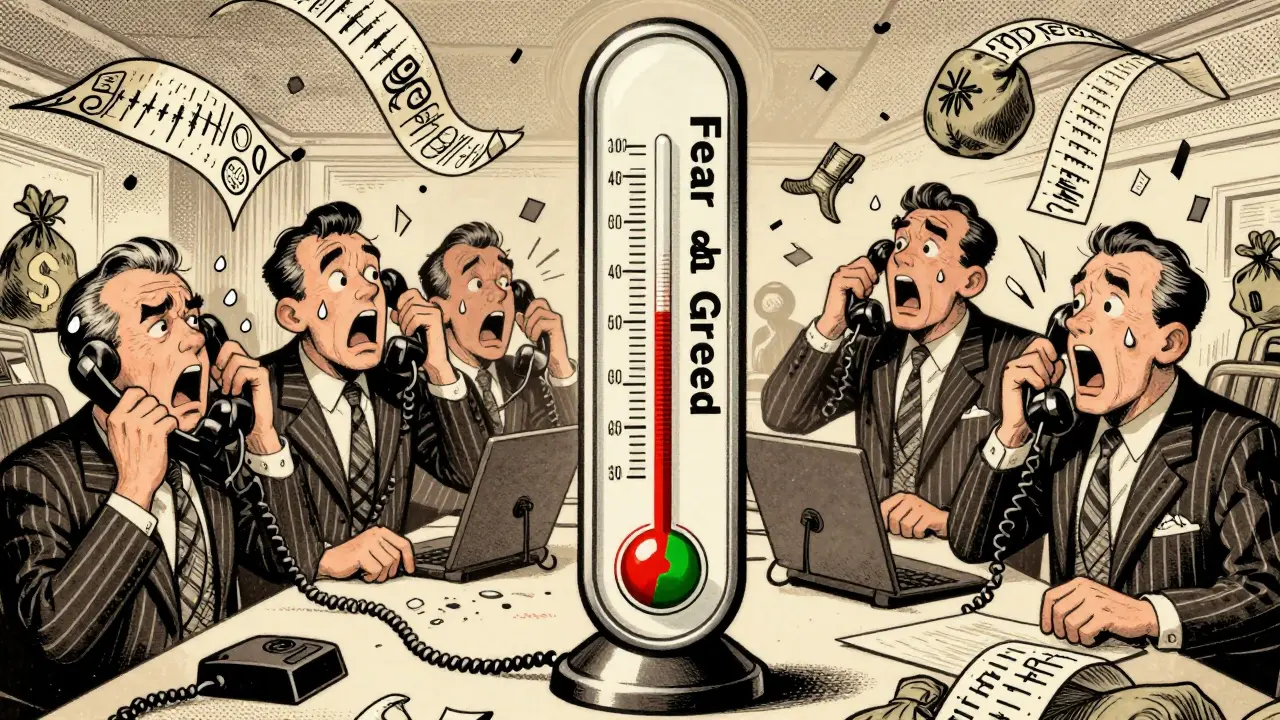
Imagine walking into a crowded room where everyone is screaming. Are they panicking because the building is on fire, or are they cheering because their favorite team just won? In financial markets, it’s often impossible to tell the difference by looking at price charts alone. That’s where the Fear and Greed Index comes in. It acts as a thermometer for investor emotion, telling you whether the market is driven by panic (fear) or euphoria (greed). Whether you are trading stocks or holding Bitcoin, understanding this metric can help you avoid making costly emotional mistakes.
You might have seen this number pop up in news headlines or on your trading app. But what does it actually mean for your portfolio? Is it a crystal ball that predicts the future, or just a mirror reflecting current chaos? Let’s break down how it works, why it matters, and how you can use it without falling into common traps.
What Is the Fear and Greed Index?
The Fear and Greed Index is a quantitative market sentiment indicator developed by CNN Money (now CNN Business) in 2012. It measures the collective emotions of investors across the stock market on a scale from 0 to 100. A score of 0 represents extreme fear, while 100 indicates extreme greed. A neutral reading sits around 50.
The core idea behind the index is simple: markets are not always rational. Investors often overreact to bad news (selling too much out of fear) or good news (buying too much out of greed). By tracking these emotional extremes, the index helps identify potential contrarian opportunities. For example, when everyone is terrified, assets might be undervalued. When everyone is greedy, assets might be overvalued.
| Score Range | Sentiment Level | Typical Market Behavior |
|---|---|---|
| 0 - 20 | Extreme Fear | Panic selling, high volatility, potential buying opportunity |
| 21 - 40 | Fear | Cautious investing, defensive positioning |
| 41 - 60 | Neutral | Balanced market conditions, steady growth |
| 61 - 80 | Greed | Optimistic buying, rising prices |
| 81 - 100 | Extreme Greed | Euphoric buying, potential market top, caution advised |
How Is the Stock Market Index Calculated?
The original CNN Fear and Greed Index doesn’t guess. It calculates its daily score using an equal-weighted average of seven distinct market indicators. Each component is normalized to a 0-100 scale before being combined. Here is what goes into the mix:
- Stock Price Momentum: Compares the S&P 500’s performance against its 125-day moving average. If the market is surging far above this average, it signals greed.
- Stock Price Strength: Looks at the ratio of NYSE-listed stocks hitting 52-week highs versus those hitting lows. More highs mean more greed.
- Stock Price Breadth: Analyzes the volume of advancing shares versus declining shares. High volume in advancing stocks suggests broad market strength.
- Put and Call Options: Measures the ratio of put options (bets on prices falling) to call options (bets on prices rising). A high put/call ratio indicates fear.
- Junk Bond Demand: Tracks the yield spread between high-yield corporate bonds and safe Treasury bonds. Narrow spreads suggest investors are taking risks (greed).
- Market Volatility: Uses the Cboe Volatility Index (VIX). High VIX readings indicate fear, while low readings suggest complacency or greed.
- Safe Haven Demand: Compares the performance of stocks against Treasury bonds. If bonds are outperforming stocks significantly, investors are seeking safety (fear).
This methodology has remained largely unchanged since 2012, providing a consistent historical baseline. However, keep in mind that this version focuses primarily on traditional equity and bond markets.
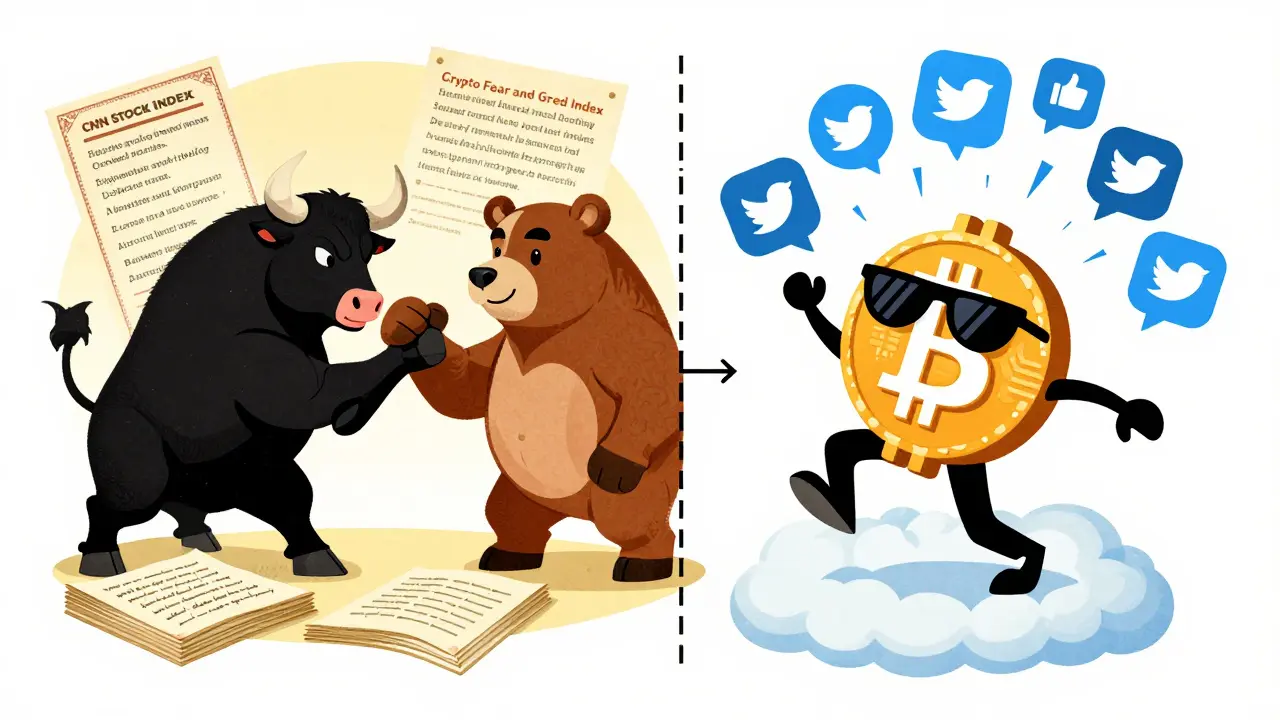
The Crypto Fear and Greed Index: A Different Beast
If you trade cryptocurrencies, you’ve likely encountered a different version of this tool. The Crypto Fear and Greed Index, created by alternative.me in 2018, operates differently from the CNN stock market index. Cryptocurrency markets are smaller, more volatile, and influenced by different factors than traditional Wall Street.
The crypto index uses four main metrics, though their weights can shift based on data availability:
- Volatility (25%): Similar to the stock index, it looks at recent price swings compared to historical averages.
- Market Momentum (25%): Tracks Bitcoin’s price movement relative to its moving averages.
- Social Media Sentiment (15%): This is unique to crypto. It analyzes mentions of Bitcoin on platforms like Twitter and Reddit to gauge public hype or panic.
- Dominance Trends (10%): Measures Bitcoin’s market share relative to other cryptocurrencies. Rising dominance often signals fear (investors fleeing to safety), while falling dominance can signal greed (risk-taking in altcoins).
In 2023, alternative.me announced plans to expand the index to include Ethereum and Solana, addressing criticism that it was too focused on Bitcoin. As of 2026, many traders check both indices, recognizing that crypto sentiment can diverge sharply from traditional market sentiment during bull runs or crashes.
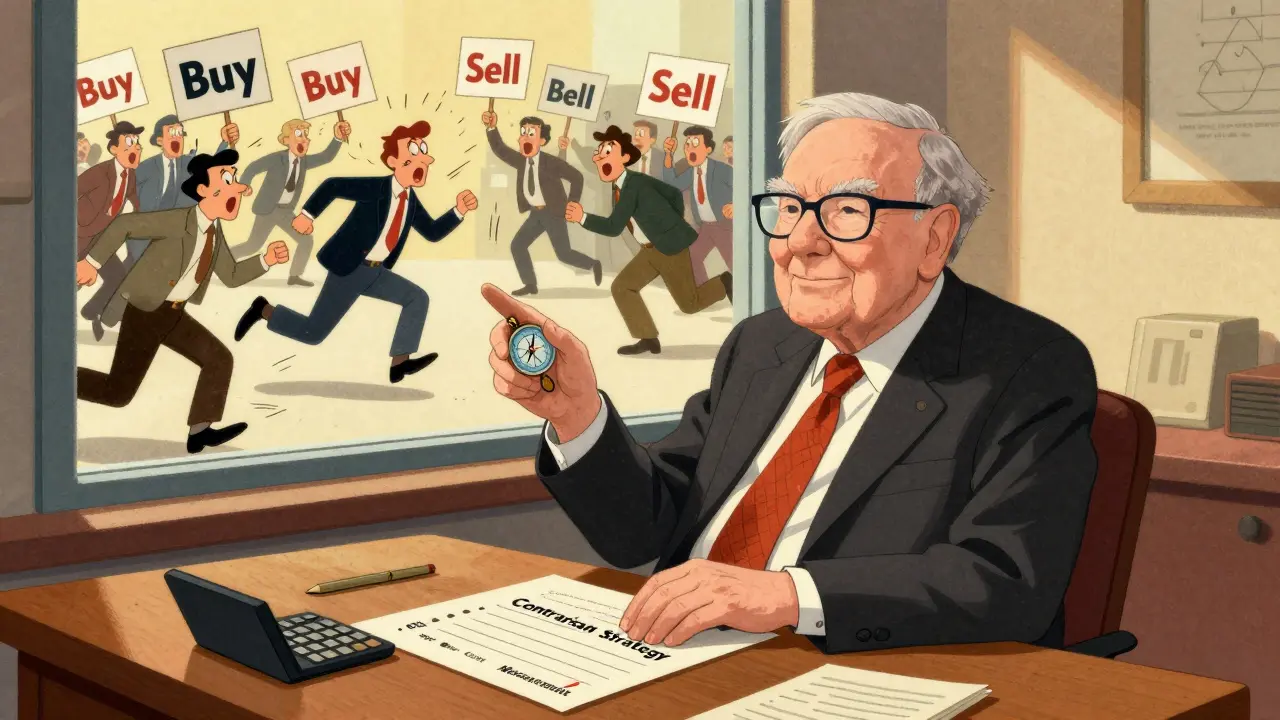
Using the Index as a Contrarian Tool
The most powerful way to use the Fear and Greed Index is as a contrarian indicator. The famous quote by Warren Buffett, "Be fearful when others are greedy, and greedy when others are fearful," perfectly summarizes this approach.
Historical data supports this strategy. During the global financial crisis in September 2008, the stock market index hit a low of 12. On March 12, 2020, amid pandemic-induced panic, it dropped to an all-time low of 2. In both cases, these extreme fear readings marked significant market bottoms. Investors who bought during these periods saw substantial returns as the market recovered.
Conversely, extreme greed readings (above 80) often precede market corrections. For instance, in late 2021, the crypto index frequently hovered near 90-100. While prices continued to rise temporarily, this level of euphoria signaled that the market was overextended. Many traders who took profits at these levels avoided the steep losses that followed in 2022.
However, timing is everything. The index tells you *what* the market feels, not *when* it will change. You can have extreme fear for weeks, and the market can keep dropping. Using the index as a standalone trigger for buying or selling is dangerous. Instead, use it as a confirmation tool alongside fundamental analysis.
Common Mistakes and Limitations
Despite its popularity, the Fear and Greed Index has limitations. Understanding these pitfalls can save you from expensive errors.
1. Ignoring Fundamentals: The index is purely technical and psychological. It ignores company earnings, interest rates, or regulatory changes. A market can be in "extreme fear" because of valid economic reasons, such as a recession. Buying blindly based on fear alone can lead to catching a falling knife.
2. False Signals in Structural Shifts: During unprecedented events, like the 2020 pandemic crash, traditional correlations broke down. The index may give mixed signals when market regimes change rapidly. Professor Hersh Shefrin notes that the equal-weighting methodology fails to account for changing market dynamics, reducing effectiveness during structural shifts.
3. Emotional Reactivity: Ironically, watching the index can make you more emotional. Seeing "Extreme Greed" might make you anxious and sell too early. Seeing "Extreme Fear" might tempt you to buy too soon. The index should inform your strategy, not dictate your emotions.
4. Lagging Nature: The index reflects current sentiment, which is already priced into the market. By the time the index hits extreme levels, the move may already be underway. It is better suited for identifying trends than predicting exact tops or bottoms.
Practical Strategies for 2026
How can you integrate the Fear and Greed Index into your investment routine today? Here are three practical approaches used by successful retail investors.
Strategy 1: The DCA Amplifier Dollar-cost averaging (DCA) involves investing a fixed amount regularly. You can enhance this by adjusting your contribution size based on the index. For example, if the index is below 25 (extreme fear), double your usual investment amount. If it’s above 75 (extreme greed), halve it or pause contributions. This method buys more units when prices are low and fewer when they are high, lowering your average cost over time.
Strategy 2: Risk Management Check Before making a large trade, check the index. If you’re about to buy a risky asset and the index shows extreme greed, ask yourself: "Am I chasing momentum?" This pause can prevent FOMO (fear of missing out) driven purchases. Conversely, if you’re considering selling due to panic, a low fear reading might remind you to hold or buy instead.
Strategy 3: Portfolio Rebalancing Trigger Use extreme readings as a cue to rebalance. If greed is high and your tech/crypto holdings have grown disproportionately, consider trimming positions to lock in gains. If fear is high and your cash position is large, consider deploying capital into undervalued assets to maintain your target asset allocation.
Future Trends and Developments
The landscape of sentiment analysis is evolving. In 2023, CNN Business experimented with adding real-time social media sentiment as an eighth component to their stock index, aiming to capture faster-moving retail trader emotions. Meanwhile, alternative.me continues to expand its crypto index coverage to include major altcoins like Ethereum and Solana.
Academic interest in the index has also grown, with numerous peer-reviewed studies analyzing its predictive power. However, some experts warn of diminishing returns. As more investors use the index, its signals may become self-fulfilling prophecies, reducing its edge. J.P. Morgan’s Quantitative Research team has projected a decline in signal strength by 2027 as adoption increases.
Despite these challenges, the human element remains constant. As long as fear and greed drive market behavior, tools like the Fear and Greed Index will remain relevant. The key is to use them wisely-not as a crystal ball, but as a compass pointing toward crowd psychology.
Is the Fear and Greed Index accurate?
The index is accurate in measuring current market sentiment, but it is not a perfect predictor of future price movements. Historical data shows that extreme readings often correlate with market turning points, but they do not guarantee immediate reversals. It should be used as one tool among many, not a standalone signal.
What is the difference between the stock and crypto Fear and Greed Index?
The stock index, created by CNN, uses seven technical indicators related to equities and bonds. The crypto index, created by alternative.me, uses four metrics including social media sentiment and Bitcoin dominance, reflecting the unique volatility and community-driven nature of cryptocurrency markets.
When should I buy based on the Fear and Greed Index?
Consider buying when the index reads "Extreme Fear" (below 20), as this often indicates undervalued assets. However, wait for confirmation from other technical or fundamental indicators before entering a position. Avoid buying solely based on the index, as markets can remain fearful for extended periods.
Can the Fear and Greed Index predict market crashes?
No, the index cannot predict crashes with certainty. It measures current sentiment, which often lags behind price action. While extreme greed readings can signal overvaluation and increased risk of a correction, they do not provide a specific timeline for when a crash might occur.
Where can I find the Fear and Greed Index?
The stock market Fear and Greed Index is available for free on CNN Business's website. The Crypto Fear and Greed Index can be found on alternative.me. Both are updated daily during market hours.
Larry Port
May 22, 2026 AT 02:50it is interesting to see how sentiment metrics have evolved since the early days of retail trading. i often find that people treat these indices as gospel rather than just one data point among many. the contrarian approach mentioned in the article is sound theory but difficult practice because human psychology fights against buying when things look scary. we tend to want confirmation bias not disconfirmation. this index forces you to look at the crowd and ask if they are right or wrong which is a painful question to answer during a crash. the inclusion of social media sentiment in the crypto version is particularly telling given how fast narratives spread now compared to traditional markets where news took time to digest. it reminds me of the efficient market hypothesis debates from decades ago. perhaps the real value is not prediction but calibration of expectations.
Bronwen Butler
May 23, 2026 AT 21:26this whole fear and greed thing is total nonsense for serious investors. nobody with actual capital looks at a cnn chart before making decisions. it is lagging garbage designed for retail gamblers who need hand holding. the market moves on liquidity and institutional flows not some arbitrary score based on moving averages and vix readings. you can have extreme fear for months while the economy collapses and then suddenly reverse without warning. relying on this is like driving by looking only in the rearview mirror. stop giving beginners false confidence with these simplistic tools.
Bridget Coogle
May 25, 2026 AT 11:35i really appreciate the breakdown here. it helps to understand why my gut feelings sometimes clash with what the charts show. being empathetic to the market mood is hard when your portfolio is down but knowing there is a metric for it makes me feel less alone in the chaos. thanks for sharing this perspective.
Matt Davis
May 26, 2026 AT 09:43Absolutely pathetic analysis. You are ignoring the fundamental reality that these indices are manipulated by central banks to herd sheep into buying dips. The 'extreme fear' signal was deliberately engineered in 2020 to absorb retail liquidity before the next bubble burst. It is not about sentiment; it is about control. The VIX is managed, the put-call ratios are spoofed by high-frequency trading algorithms, and the social media sentiment is seeded by astroturfing campaigns. To suggest this is a neutral tool is either ignorance or complicity. Wake up.
Amit Varpe
May 27, 2026 AT 09:09lol this is so us centric 🇺🇸. in india we dont care about cnn stuff. we have our own nifty fear gauge and it works better for local context. also emojis make everything clearer than long paragraphs 😂
beti macedo
May 28, 2026 AT 13:48thsi is such a beautifull concept! i love how it brings structure to the chaos of emotions. i think everyone should try to use it becaus it helps in staying calm during volatile times. the idea of doubling dca during fear is very encouraging and gives hope that we can turn panic into profit. please keep writing such informative posts!
Yash Lodha
May 29, 2026 AT 03:11The correlation between the index spikes and scheduled geopolitical events is too precise to be coincidental. I have tracked the timestamps of 'extreme fear' declarations against black swan announcements and found a pattern of pre-emptive signaling. Who controls the narrative controls the wallet. This index is likely a feedback loop created by algorithmic traders to induce mass liquidation at specific price levels. The social media component is particularly sinister as it allows for real-time manipulation of public perception through bot networks. We are not investors; we are subjects in a behavioral experiment.
Jocelyn Garcia
May 30, 2026 AT 04:39the alpha decay on this metric is real though. once everyone knows the strategy the edge disappears. i see a lot of noise in the junk bond demand component lately. the yield spreads are decoupling from historical norms due to quantitative easing distortions. it is becoming harder to interpret the signal vs noise ratio. maybe we need a dynamic weighting system instead of equal weights. the current static model feels archaic for 2026 market structures.
Michelle Bonahoom
May 31, 2026 AT 13:47boring read. another day another generic finance blog post trying to sell hope. nobody wants to hear about rebalancing triggers they want to know which coin pumps tomorrow. this index is useless for short term gains and irrelevant for long term holders who just hodl anyway. waste of time reading this fluff.
Albert Lee
May 31, 2026 AT 16:52I am so glad someone wrote this clearly! It is incredibly stressful watching the markets swing wildly and feeling like you are losing your mind. Knowing that there is a measured way to view this emotion helps me breathe easier. I am going to start using the DCA amplifier strategy immediately because I need to feel more in control of my financial destiny. Thank you for being a supportive voice in this chaotic space!
Bianca Vilas Boas Lourenço
June 1, 2026 AT 13:07Oh wow, another 'expert' telling us to buy the dip 🙄. Have you ever actually lost money? Because I have. And let me tell you, when the index says 'Extreme Fear' and you buy, you still lose 50% more before it turns around. It is not a crystal ball, it is a participation trophy for losers who get caught holding the bag. Stop pretending this sophisticated jargon saves you from being fleeced by the whales 🐋💀.
Jesse Alston
June 2, 2026 AT 09:09Great summary of the mechanics 👍. One thing I would add is that the crypto index's reliance on Bitcoin dominance can be misleading during altcoin seasons. When BTC dominance drops rapidly, the index might signal fear due to flight to safety, but actually, it could be speculative greed flowing into smaller caps. Traders should watch the divergence between the two indices closely. Also, the VIX term structure is a better leading indicator than spot VIX alone. Happy trading! 🚀
Ankush Pokarana
June 2, 2026 AT 17:07we must consider the philosophical implications of quantifying emotion. by reducing complex human states to a single number we risk oversimplifying the nature of market participation. the index assumes rationality in its construction yet measures irrationality in its output. this paradox suggests that the tool itself may become part of the problem by creating a self-referential loop of behavior. however if used with humility it can serve as a mirror reflecting our collective anxiety back to us allowing for introspection rather than just reaction. the key is mindfulness not just mechanics.
Zara Zaman
June 3, 2026 AT 22:12This foreign nonsense does not apply to our sovereign markets. We do not need American CNN metrics to tell us how to invest. Our domestic indicators are superior and reflect the true strength of our national economy. Relying on external sentiment scores is a sign of weakness and lack of faith in our own financial institutions. Stick to local advice and ignore these globalist distractions.
Pauline Larocco71
June 3, 2026 AT 22:30i found this really helpful espescially the part about emotional reactivity. it is so easy to get swept up in the hype or the panic. having a concrete number to check helps ground me. i will definitely be keeping an eye on both the stock and crypto versions now. thanks for the clear explanation!