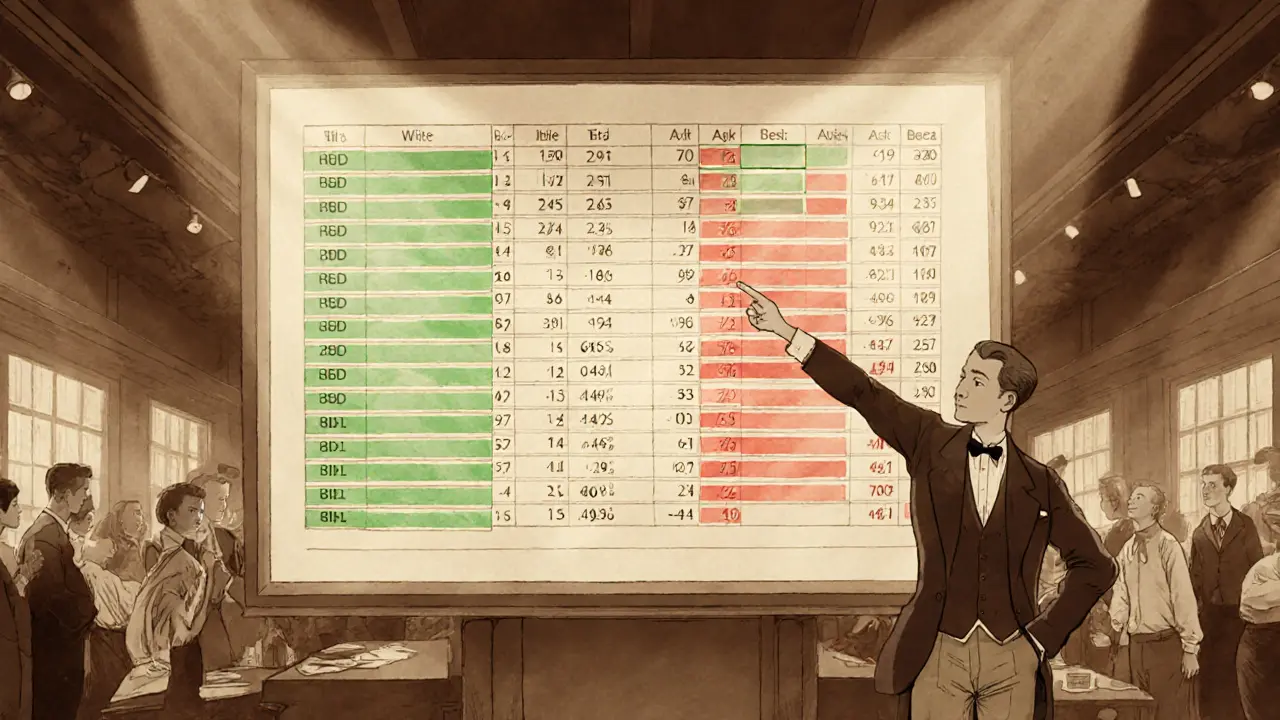
Order Book Visualization Simulator
| Price Level | Volume | Order Type |
|---|
How to Interpret This Data
• Bids (green): Buyers willing to purchase at or below this price
• Asks (red): Sellers willing to sell at or above this price
• Best Bid: Highest price buyers are willing to pay
• Best Ask: Lowest price sellers are willing to accept
• Bid-Ask Spread: Difference between best bid and ask prices
The depth of the market shows how much liquidity exists at each price level. A deep market can absorb large orders without significant price movement.
Order book data gives insight into market sentiment and liquidity, helping identify potential support/resistance levels before they appear on price charts.
When you hear the term order book data, you might picture a wall of numbers scrolling across a screen. In reality, it’s the live ledger that shows every buy and sell intent for a financial instrument, from stocks to crypto. Grasping how this data works can turn a vague market feel into a concrete edge for any trader.
What Exactly Is an Order Book?
At its core, an Order Book is a real‑time record of all open limit orders for a given asset. The list is split into two sides:
- Bid: Buy orders sorted from highest price down. The topmost entry is the Best Bid, the most a buyer is willing to pay.
- Ask: Sell orders sorted from lowest price up. The first line is the Best Ask, the cheapest price a seller will accept.
The gap between the best bid and best ask is the Bid‑Ask Spread, a key liquidity indicator.
Why Order Book Data Beats Simple Price Charts
Traditional price charts only show executed trades-what actually happened. An order book reveals the whole picture: pending demand, pending supply, and where traders are stacking their orders. This extra layer lets you spot support and resistance before the price gets there, gauge the true depth of a market, and anticipate short‑term moves.
Key Analytical Dimensions
Professional traders slice the order book in several ways:
- Market Depth (or Depth of Market, DOM) shows how much volume sits at each price level. A deep market can absorb large orders with little price impact.
- Order Flow tracks the arrival, modification, and cancellation of orders. Aggressive buying shows up as a wave of bids hitting the ask side.
- VWAP (Volume‑Weighted Average Price) strategies use order‑book volume to execute sizable trades close to the average price, reducing slippage.
- Historical Order History provides a record of completed trades, useful for pattern recognition.
How to Read the Order Book in Real Time
Start with the top‑five rows on each side. Note the cumulative totals-these numbers tell you how much liquidity you’d need to push the price past a given level. For example, if the ask side shows 2,000 contracts at $50.10 and another 3,500 at $50.12, you’d need 5,500 contracts to move the market above $50.12.
Watch for imbalances: a heavily populated bid side often signals bullish sentiment, while a thick ask side hints at bearish pressure. However, be wary of Spoofing-traders placing large orders they intend to cancel to mislead the market.
Tools and Visualizations
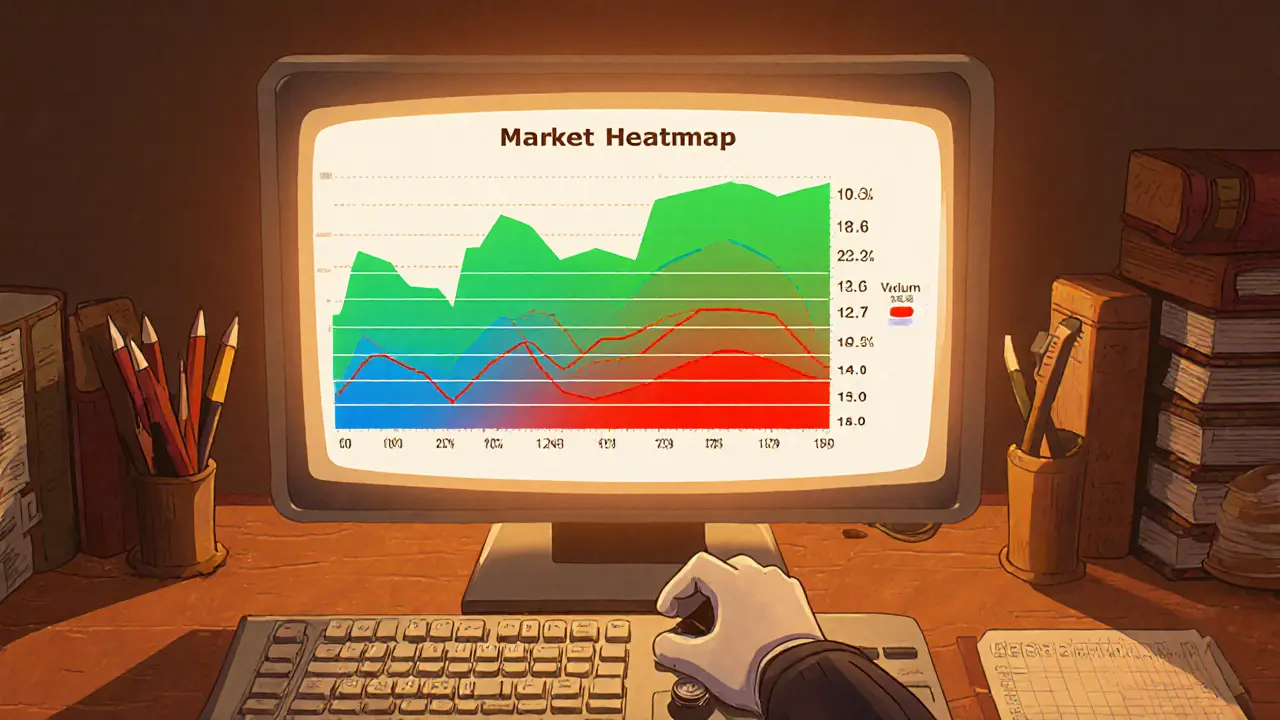
Most platforms display the order book as a table with color‑coded rows (green for bids, red for asks). Advanced tools add heatmaps that shade each price level based on volume intensity, making clusters pop out at a glance.
| Feature | Order Book | Price Chart |
|---|---|---|
| Shows pending orders | ✓ | ✗ |
| Real‑time liquidity | ✓ | ✗ |
| Historical price only | ✗ | ✓ |
| Supports depth analysis | ✓ | ✗ |
| Vulnerable to spoofing | ✓ (needs caution) | ✗ |
The table makes it clear why many algorithmic traders rely on order‑book feeds rather than just candlesticks.
Automation and the Future
High‑frequency trading firms (HFT) crunch order‑book data at microsecond speed, feeding it into Machine Learning models that spot micro‑patterns invisible to the human eye. Emerging heatmap visualizations and 3‑D depth charts aim to make those patterns easier for everyday traders to digest.
Regulators are tightening rules around order‑book transparency and spoofing detection, which means data quality will keep improving, but also that compliance checks become part of any automated strategy.
Common Pitfalls and How to Avoid Them
- Information overload: Focus on the top 5‑10 levels; deeper rows add noise unless you’re trading very large blocks.
- Chasing false signals: A sudden surge of bids can disappear in milliseconds. Confirm with volume and price action before acting.
- Neglecting latency: In fast markets, even a 100‑ms delay can turn a profitable signal into a loss. Choose a low‑latency feed if you plan to trade on order‑flow.
- Ignoring market structure: Different venues display depth differently. Learn the conventions of each exchange (e.g., crypto vs. equities).
Getting Started: A Step‑by‑Step Checklist
- Open a platform that offers a live order‑book window (most broker‑dealers, crypto exchanges, or specialized depth‑view tools).
- Set the view to show at least the top 10 bid and ask levels.
- Apply a cumulative total column to see how much volume sits at each price tier.
- Identify any large clusters (e.g., >10,000 contracts) - these act as potential support or resistance.
- Watch for rapid order cancellations; a high cancel‑to‑fill ratio can hint at spoofing.
- Combine the visual cues with a basic price chart to confirm the direction.
- Test a small position first, measuring slippage against the predicted depth.
Following this checklist for a few weeks will give you a feel for how the book reacts to news, earnings releases, or macro events.
Frequently Asked Questions
How often does the order book update?
Professional feeds refresh thousands of times per second. Retail platforms usually update every 100‑200ms, which is sufficient for most day‑trading strategies.
Can I rely on order‑book data for swing trading?
Yes, but combine it with longer‑term indicators. The book shows short‑term pressure, while swing trades benefit from confirming trends on daily or weekly charts.
What’s the difference between market depth and order flow?
Market depth is a snapshot of volume at each price level. Order flow tracks how that snapshot changes over time-new orders, cancellations, and executions.
Is spoofing illegal?
Regulators in the US, EU, and many Asian markets consider deliberate spoofing a market‑manipulation violation, punishable by fines and bans.
Do crypto exchanges provide the same level of depth as stock markets?
Often not. Crypto venues can have thinner books and larger spreads, especially for less‑traded tokens. This makes order‑book analysis even more critical for crypto traders.
ashish ramani
October 3, 2025 AT 07:57Order book data is the real deal if you want to see what’s actually happening before the price moves. I’ve seen traders get burned chasing fake liquidity-those big bid clusters that vanish in 200ms. Stick to the top 10 levels, and always cross-check with volume.
Sarah Hannay
October 3, 2025 AT 20:41The precision with which order book dynamics reflect market sentiment is statistically significant and cannot be overstated. The bid-ask spread, when analyzed in conjunction with volume-weighted average price, provides a robust framework for microstructure analysis. One must, however, account for latency differentials and exchange-specific conventions to avoid systemic misinterpretation.
Richard Williams
October 4, 2025 AT 02:35Great breakdown. I started using DOM last year after getting wrecked by a spoofing move on BTC. Now I only look at the top 10 levels and wait for confirmation on price. If you’re new to this, don’t try to read every tick-just watch for volume spikes and cancellations. It’s not magic, but it’s way better than just looking at candles.
Prabhleen Bhatti
October 4, 2025 AT 11:47Order book analysis is the ultimate edge-especially in crypto, where liquidity is thin and manipulations are rampant. You need to understand not just depth, but order flow velocity-how fast bids are getting eaten, how often asks are being lifted. The VWAP strategy I use relies entirely on this. If you're not tracking cancellations, you're trading blind. And yes, spoofing is everywhere-especially on Binance and OKX. Always verify with on-chain volume and time & sales.
Elizabeth Mitchell
October 5, 2025 AT 10:18I used to ignore the order book. Thought it was for robots. Then I watched a 500 BTC bid disappear right before a 12% drop. Now I check it every morning. It’s not perfect, but it’s the closest thing to seeing the future.
Chris Houser
October 6, 2025 AT 02:19For beginners, start simple. Look at the top bid and ask. See if the spread is widening. If bids are growing but price isn’t moving, that’s accumulation. If asks are piling up and no one’s buying? That’s distribution. Don’t overthink it. Just watch. Then trade small. Learn. Then scale.
William Burns
October 6, 2025 AT 19:32It is patently obvious that retail traders who rely on retail-grade order book visualizations are engaging in a form of financial self-deception. The data is delayed, fragmented, and deliberately obfuscated by HFT firms. To claim that one can derive meaningful insight from a 200ms-refreshed DOM is not merely naive-it is economically irresponsible. One must access direct market feeds, raw TCP packets, and co-located servers-or simply accept irrelevance.
Ashley Cecil
October 7, 2025 AT 04:47There is a critical distinction between 'order book data' and 'price action.' The former is a reflection of intent; the latter, a record of execution. Confusing the two leads to misallocation of capital. Furthermore, the term 'spoofing' is legally defined under SEC Rule 15c6-1 and CFTC Regulation 180.1. It is not merely 'tricky behavior'-it is fraud. Always cite your sources when discussing regulatory frameworks.
John E Owren
October 7, 2025 AT 17:47I used to think order books were too complicated. Then I started watching just the top 5 levels for 10 minutes a day. I didn’t trade. Just watched. After two weeks, I could see patterns. Like when the bid side suddenly thickens but no trade happens-that’s someone testing the waters. It’s not about predicting the future. It’s about sensing the mood. And that’s enough.
Jennifer Rosada
October 7, 2025 AT 22:49Let’s be honest-90% of retail traders who 'analyze order books' are just looking at pretty colors and calling it 'strategy.' They don’t understand latency, exchange-specific depth formats, or the fact that 70% of large orders are iceberg orders. You think you’re seeing liquidity? You’re seeing smoke and mirrors. And you’re paying for it with your account balance.
adam pop
October 8, 2025 AT 04:13Order books are rigged. The exchanges feed fake data to trigger stop losses. The HFTs are all connected to the Fed. They know when the Fed’s gonna drop a rate decision, and they move the book 30 seconds before it’s public. That’s why you always get stopped out right before the big move. It’s not trading-it’s a casino controlled by the banks. Don’t fall for it.
Dimitri Breiner
October 8, 2025 AT 11:38One thing I’ve learned: the best trades aren’t the ones where you predict the move-they’re the ones where you wait for the order book to tell you it’s safe to enter. If the ask wall is 10,000 contracts thick and it starts melting slowly, that’s not a breakout-it’s a trap. Wait for the volume to confirm. Patience isn’t passive. It’s precision.
LeAnn Dolly-Powell
October 8, 2025 AT 17:42This was so helpful!! 😊 I used to just stare at candles and guess. Now I actually look at the order book before I click buy. I even made a little chart in Notion to track big clusters. It’s not perfect, but I’m finally making more wins than losses. Thank you for making this so clear!! 🙌
Anastasia Alamanou
October 9, 2025 AT 03:50For those new to this, remember: order book depth is not static. It’s a living ecosystem. What looks like support at $50.10 might be a single market maker with 2,000 contracts sitting there to absorb pressure. Look for consistency across time-do those levels reappear after each pullback? That’s real structure. And always cross-reference with volume profile. Depth without context is just noise.
Rohit Sreenath
October 10, 2025 AT 01:17The order book is just a distraction. The real market is in the minds of men. When fear is high, the bids vanish. When greed is high, the asks disappear. The numbers don’t move the market-human emotion does. You can’t trade a spreadsheet. You must feel the pulse. That’s why most traders fail-they think in data, not in energy.
Sam Kessler
October 10, 2025 AT 07:22Let me tell you something: the order book is a weaponized illusion. Every exchange manipulates the display to favor their own proprietary traders. The data you see is sanitized, delayed, and filtered. The real order book-the one that matters-is only accessible to institutions with direct market access. You’re being fed a cartoon. Don’t confuse the map for the territory.
Steve Roberts
October 10, 2025 AT 10:35Everyone’s acting like this is some revolutionary insight. Newsflash: the order book has been around since the 1980s. The fact that you’re only now realizing it’s useful means you’ve been trading with your eyes closed. And no, you don’t need a heatmap. You need a brain. And a loss limit.